Analyzing MySQL slow log is one of the basic and most powerful ways to speed up a website and prevent overloading the database server. The idea is to look at SQL queries that took too long and were frequently executed, and then optimize them (by adding indexes or rewriting, grouping, splitting, etc.).
I use Percona Toolkit for this, but it is only available for Linux. How to deal with it on Windows 10? I have prepared a detailed guide.
In short:
- Install Ubuntu subsystem.
- Install MySQL server in it.
- Configure it - change its port so that we can use it alongside the current server from WAMP on Windows!
- Install Percona Toolkit.
- Upload slow query log from the production server to it.
- Download Anemometer tool.
- And start analyzing!
1. Installing Ubuntu bash
First, we install Ubuntu from Microsoft Store.

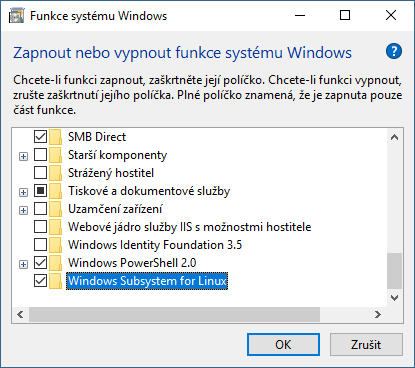
Then we need to enable Windows subsystem - Control Panel -> Programs and Features -> Turn Windows features on or off. Then restart the computer.
2. Installing MySQL
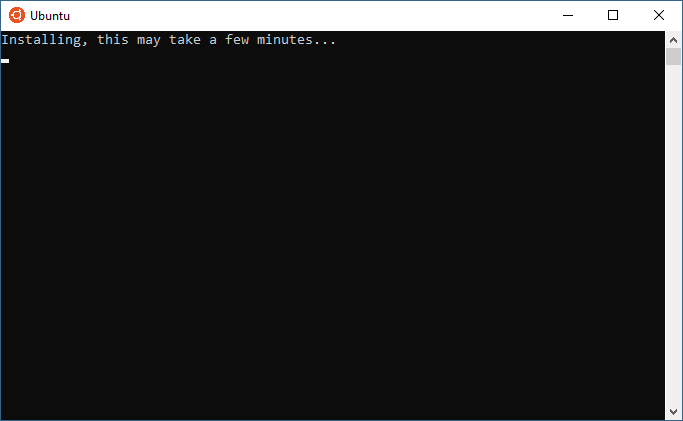
After the first launch of Ubuntu, we need to wait a while until it is fully installed. Then we choose a login and password for the newly created user.
Then we switch to the root user:
sudo su
We update the package list:
apt-get update
We install MySQL server:
apt-get install mysql-server
3. Configuring MySQL
Now we change the port of our newly installed MySQL server so that we can use it alongside the MySQL server installed directly on Windows (assuming we have some WAMP). The latter will probably have port 3306. We set Ubuntu MySQL server to, say, 5123. First, we open the configuration file (it may be elsewhere…you need to search for it):
nano /etc/mysql/mysql.conf.d/mysqld.cnf
We change the port to 5123. We also set sql_mode="":
sql-mode=""
And we save the file (Ctrl+X, Y). We start the MySQL server:
service mysql start
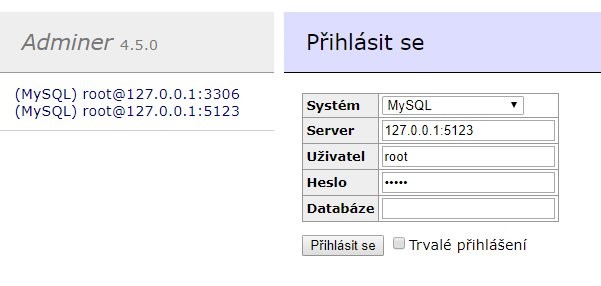
Now we can use the newly installed MySQL server through Ubuntu Bash. What if we want to access it through a GUI tool, such as Adminer, which we already have on WAMP? It’s simple, we specify the port when logging in:
4. Installing Percona Toolkit
On the Percona Toolkit page, we find the .deb package for our platform, copy its URL, and return to Ubuntu Bash. There we download it:
wget https://www.percona.com/downloads/percona-toolkit/3.0.6/binary/debian/xenial/x86_64/percona-toolkit_3.0.6-1.xenial_amd64.deb
And we install it:
dpkg -i percona-toolkit_3.0.6-1.xenial_amd64.deb
Oops, we are missing some dependencies, so we call:
apt-get install -f
And then we better reinstall:
dpkg -i percona-toolkit_3.0.6-1.xenial_amd64.deb
5. Uploading slow log to Percona
We download or request the MySQL slow log from the server administrator. We save it, say, on the desktop here:
C:\Users\skoul\Desktop\slow-query\slow-query.log
In Ubuntu, we switch to this folder (note the path /mnt/c/ - this is how we get from Ubuntu to Windows):
cd /mnt/c/Users/skoul/Desktop/slow-query
And we go. With this command, we upload the raw slow log to the Percona Toolkit database (which is created automatically). It takes a while.
pt-query-digest –user=root –password=YOURPASSWORD –review h=localhost,D=slow_query_log,t=global_query_review –history h=localhost,D=slow_query_log,t=global_query_review_history –no-report –limit=0% –filter=" \$event->{Bytes} = length(\$event->{arg}) and \$event->{hostname}=\"$HOSTNAME\"" slow-query.log
6. Installing Box Anemometer tool
Finally, we install Anemometer, in which we will analyze the logs. We download and unpack the script somewhere on our WAMP.
Now in the conf folder, rename sample.config.inc.php to config.inc.php.
Then, in the same folder, edit the datasource_localhost.inc.php file - just change the port of the Ubuntu MySQL server (5123) and fill in the password.
7. Analysis
Anemometer nicely groups slow queries by their footprint (query without parameters) and allows us to sort them most frequently by “Query_time_sum DESC” - i.e., by the total time this query took in all its executions. Here we need to see how urgently we need to optimize the first query.

Regarding MySQL optimization, I recommend the book High Performance MySQL.